Advanced stats
LongoMatch PRO offers a range of statistic information about the project and the events you have tagged in the project. You will find the statistics button under ‘Tools’ in the top menu.
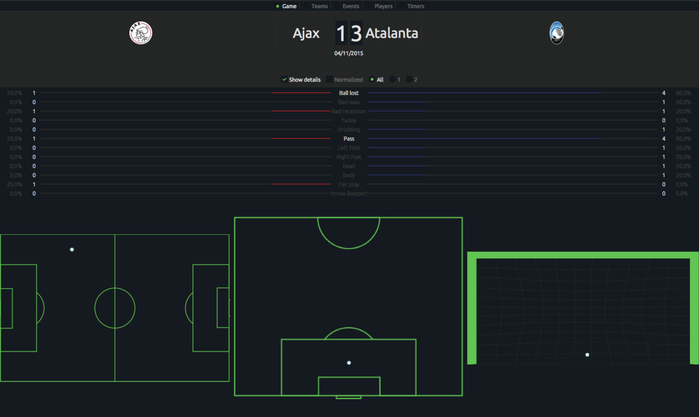
When using this option, a window will appear showing the amount of tags made for each main category specific to that game. Using the check mark boxes just above the screen, you have the option to either select a team or a period of the game as defined by the analysis dashboard and display the related events.
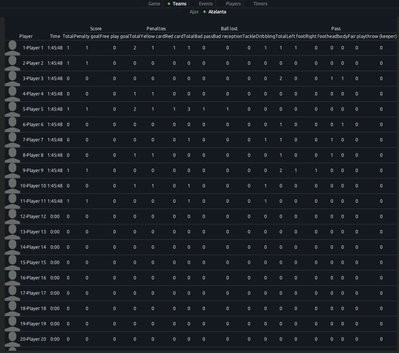
The next option is to show the statistics of the team as with a breakdown per player. You can select which team you want to see the statistics of.
Another option is to show the events and their position on the field. For this, you can use the ‘events’ check mark box in the statistics window. This will show the events as a total and per team on the fiel. You can select the category of the tags which you want to see, e.g., ‘Personal Fouls Made’.
The last option within the Advanced Statistics is an individual recap about all the events and actions related to player. This information is based, of course, on the tags you have used in connection to each player.
Each category will be displayed on a field diagram, if this option is selected earlier in the analysis dashboard and shown with a graphic (either a bar diagram or pie chart).